Situation:
Customers often came to
us with early-stage ideas for Industry 4.0 services but lacked
clarity on feasibility and user value.
Task:
Our goal was to validate these ideas by making them tangible,
testable, and aligned with real user needs.
Action:
I led user research and co-facilitated design thinking
workshops to uncover needs, then helped turn insights into
prototypes we tested with end users.
Result:
This fast, iterative process helped clients validate or pivot
early. Several validated concepts advanced to MVP development with
reduced risk and clearer direction.
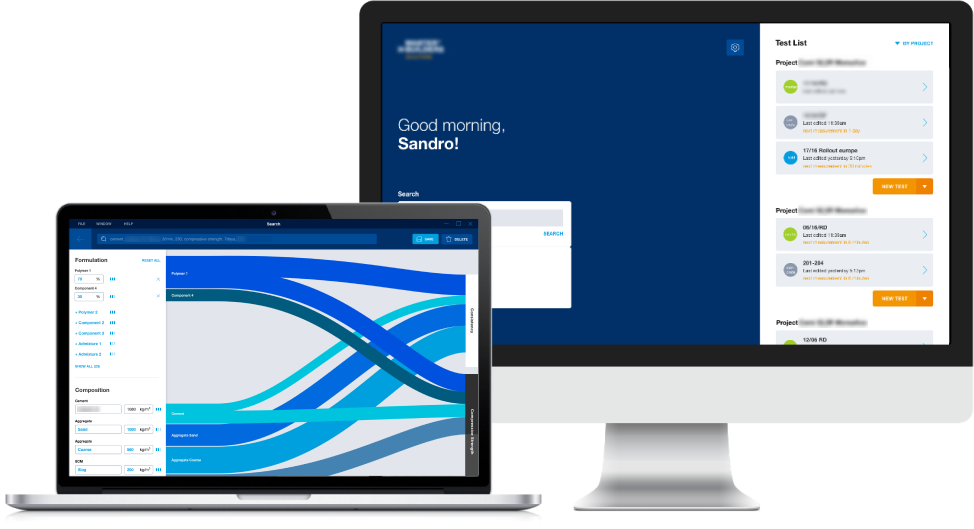
Working with three big chemical companies in Germany over the last decade, I learned, that parts of the industry were and are still facing issues in knowledge distribution and a lack of big data management, among other more pressing issues like sustainability.
As a person who has always been drawn to the sciences, I am highly motivated to understand complex processes like the ones in the chemical sector. Designing easy-to-use solutions for highly trained and knowledgeable professionals is often challenging but always immensely rewarding.
Users of professional software expect their tools to be highly efficient and effective, especially since they rely on them every day, unlike general consumer products. However, it is essential to recognize the diversity of user groups: young professionals who may require guidance through the process, experienced colleagues who primarily need to familiarize themselves with new software features, and occasional users whose main focus lies outside the tool’s primary domain.
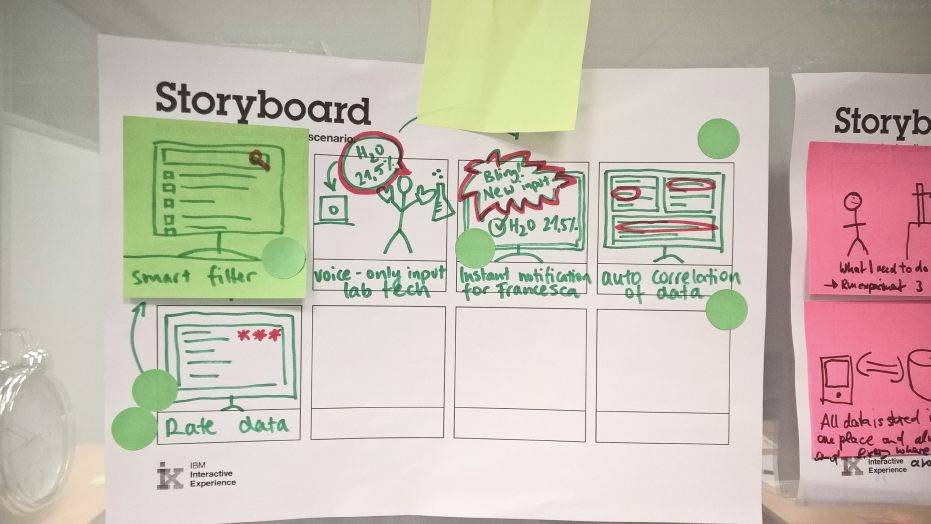
In these projects, we conducted short discovery sprints (2-4 weeks). As a seasoned user experience designer, my approach is to intensely involve domain experts as partners in these sprints: Conducting expert interviews, building low-level prototypes within the first or second week, and, subsequently, extensive user testing. Throughout the sprints, we move through all types of qualitative and quantitative research, covering market research, concept validation, and usability testing.
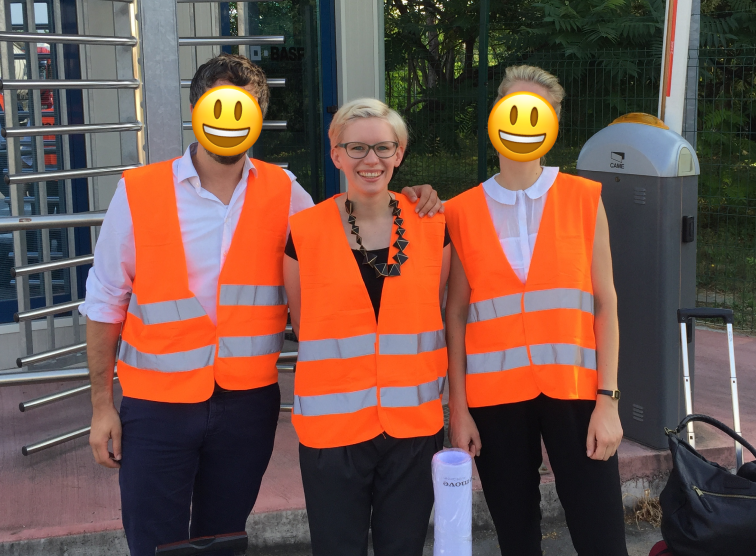
Whenever possible, I meet users in their workplace to understand their workflows and identify how digital components can seamlessly integrate into their work routines. As a researcher, my role is to observe, understand, remain open to all interview outcomes, and be approachable for any concerns, suggestions, or ideas. I iteratively analyze interview transcripts to distill key insights. To ensure clarity and accessibility for the entire team, I prefer using need statements, which are straightforward to write and easy to understand.
The success factors of these sprints were the interdisciplinary development team, and the involvement of so-called “sponsor users“ (a term from IBM's Enterprise Design Thinking) in reviews and scoping. During the scoping process for a new tool or feature, it is crucial to address users’ key pain points early on while balancing these with business objectives. Ultimately, user value drives business value.
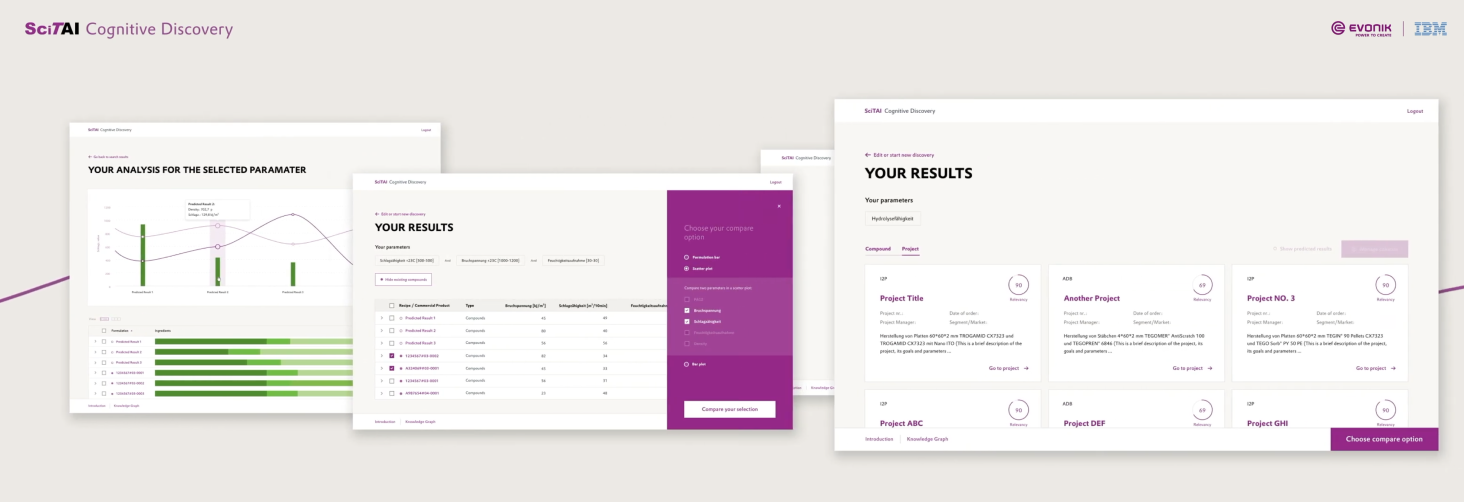
One of the projects I can openly share is a collaboration of Evonik and IBM to build a Scientific Technical Support by AI. This tool helps their compound experts to get easy access to the accumulated knowledge of internal research results via an intelligent graph database.
Understanding how data is processed in the background is crucial for a designer when creating a front-end that enables chemists or process engineers to work effectively—without requiring them to comprehend the underlying data structure or processing mechanisms.
Contrary to the initial impulse to display all data and options upfront in a densely packed dashboard, the SciTAI tool features a simple search field on its homepage. Only in the search results, data is shown in smart list views and can be visualized for comparison.
In this project, my role involved iterating filter options and expanding the range of data visualization features. Collaborating closely with data scientists and developers, we adapted the interface to incorporate new capabilities of the underlying knowledge graph.
Check out this short video explaining the project